Axos Financial (AX)·Q2 2026 Earnings Summary
Axos Crushes Estimates with $2.22 EPS, Stock Jumps 3%
January 29, 2026 · by Fintool AI Agent
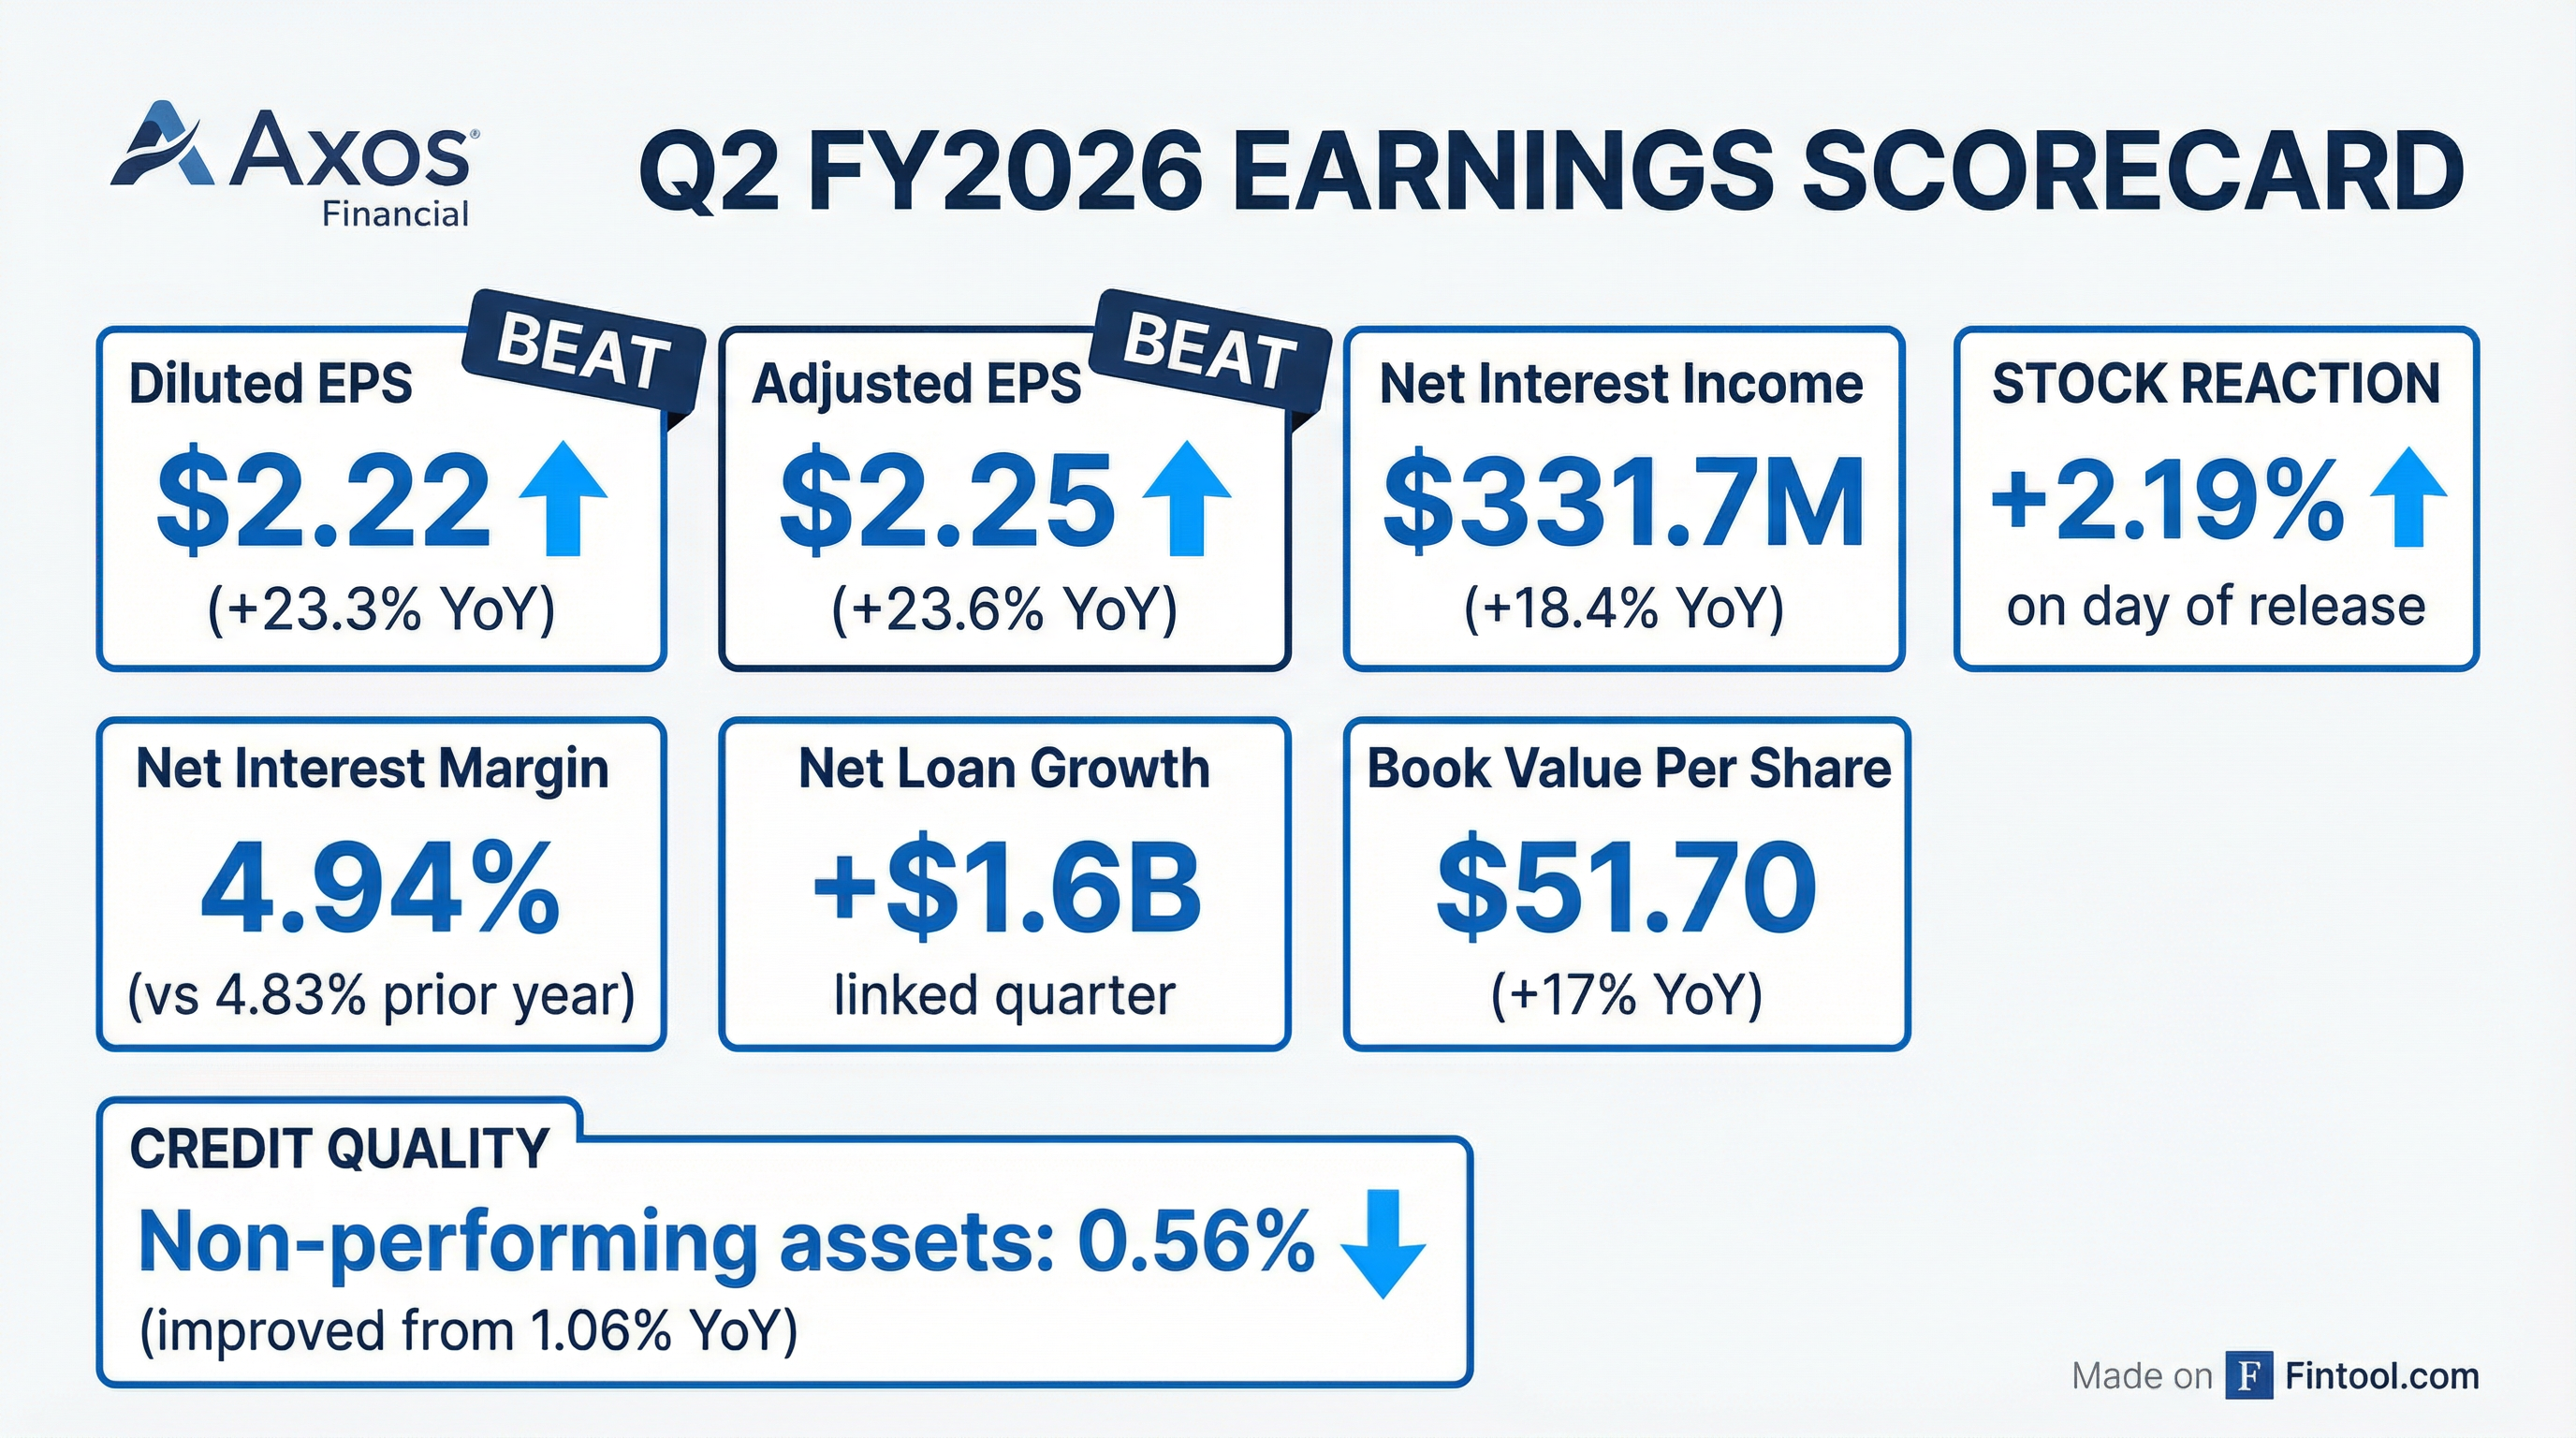
Axos Financial delivered a standout Q2 FY2026, beating consensus expectations across every major metric. Diluted EPS of $2.22 topped the Street's $2.07 estimate by 7.2%, net interest income surged 18% year-over-year to $331.7 million, and the bank posted record quarterly loan growth of $1.6 billion. The digital bank's net interest margin expanded to 4.94%, well above the 4.7% analysts had modeled. Shares jumped approximately 3% to $94.64 in afternoon trading.
Did Axos Beat Earnings?
Axos crushed it. The company delivered beats across all key metrics:
This marks the fifth consecutive quarter of EPS beats for Axos. The magnitude of this quarter's beat—particularly on NII and non-interest income—reflects the successful integration of the Verdant acquisition and accelerating organic loan growth.
What Drove the Beat?
Net Interest Income Surge
The headline story is NII growth. Net interest income jumped 18.4% year-over-year and 14% sequentially to $331.7 million. Several factors contributed:
-
Organic Loan Growth: Net loans increased $1.64 billion linked quarter (+7.2% QoQ), with strength across commercial real estate specialty, capital call facilities, single-family warehouse, and equipment leasing.
-
NIM Expansion: Net interest margin expanded 19 bps sequentially to 4.94% from 4.75% in Q1 FY26, driven by favorable asset repricing and an FDIC loan prepayment.
-
FDIC Loan Accretion: A prepayment in the FDIC-purchased loan portfolio contributed to higher-than-normal accretion income.
CEO Greg Garrabrants noted: "Strong net interest income growth and a solid net interest margin resulted in a 23.3% year-over-year increase in our diluted earnings per share this quarter."
Verdant Acquisition Contribution
The Verdant Commercial Capital acquisition, completed in Q1 FY26, is now fully contributing:
CFO Derrick Walsh highlighted that excluding Verdant-related expenses and a one-time $7M accrual related to the Cor Clearing acquisition, core non-interest expenses were "roughly flat quarter over quarter." The company is committed to keeping salaries and professional services expense growth at 30% of revenue growth or lower.
Verdant contributed approximately $130 million of net loans and operating leases in Q2, and management expects $150-200 million per quarter going forward.
How Did Key Metrics Trend?
Quarterly Financial Performance
EPS accelerated sharply this quarter (+14.4% QoQ), breaking out of the $1.80-$1.94 range that held for the prior four quarters.
Loan Portfolio Growth
Total loans reached $24.8 billion, up $1.64 billion (+7.1%) linked quarter and $4.8 billion (+23.7%) year-over-year.
The loan mix continues to shift toward higher-yielding C&I and CRE specialty lending, while multifamily runoff has moderated significantly.
What About Credit Quality?
Credit metrics improved across the board, a notable achievement given the aggressive loan growth:
Non-accrual loans declined to just 0.61% of total loans—down sharply from 1.26% a year ago. The allowance coverage ratio of 216% provides substantial cushion for potential credit deterioration. Net charge-offs of just 4 basis points were the lowest in over two years.
Total non-accrual loans fell to $152 million from $170 million in Q1 FY26 and $252 million in Q2 FY25.
What Did Management Guide?
Management did not provide explicit quantitative guidance but reiterated key operating targets from prior calls:
Loan Growth: Expect organic loan growth at the "mid to high end" of the high-single-digit to low-teens annual range.
Net Interest Margin: NIM (ex-FDIC accretion) expected to remain at the "high or slightly above" the 4.25%-4.35% range. Excluding the FDIC loan prepayment and Verdant securitizations, Q2 NIM was "roughly flat" linked quarter.
Tax Rate: Effective tax rate expected at 26%-27% going forward (down ~3 percentage points from prior 29%-30% guidance due to California tax law changes).
Loan Pipeline: $2.2 billion as of January 23, 2026, consisting of:
- Single-family residential jumbo: $598M
- Gain on sale mortgage: $75M
- Multifamily/small balance commercial: $200M
- Auto and consumer: $82M
- Commercial lending: $1.2B
Near-Term Loan Growth: Management expects $600-800 million of loan growth in Q3 FY26, supported by January starting balances approximately $800 million higher than the Q2 average.
NIM Outlook: Expect 5-6 basis points of NIM compression in the March quarter relative to the adjusted December quarter NIM (4.72% ex-FDIC accretion), driven by the ~90% downward deposit beta achieved on the last 50 bps of rate cuts. FDIC accretion is expected to contribute only 10-15 bps going forward (down from ~22 bps in Q2).
Verdant EPS Accretion: Management expects Verdant to achieve the mid to high end of the initial 2-3% EPS accretion projection in FY2026 and 5-6% accretion in FY2027.
What Were the Key Q&A Highlights?
On CRESL Growth Drivers: The $1.1B commercial real estate specialty growth was driven primarily by a slowdown in repayments. CEO Garrabrants explained that the prepayment bulge from COVID-era caution is normalizing: "If you think about these deals as three-year kind of average lives... there were just timeframes where we weren't sure where things were going, and we were more cautious. But then you just ended up having little prepay bulges."
On AI Strategy: Garrabrants expressed significant enthusiasm about AI's impact on operating leverage: "I really do see a bending of that cost curve with respect to our ability to do a lot more development... The ability to be able to rapidly respond to customer needs through really staying close to the customer from a platform perspective and then being able to react in more real time to those needs." The company is deploying AI across: software development lifecycle, credit underwriting, portfolio management, and compliance monitoring.
On Verdant Synergies: The acquisition is producing unexpected wins—Verdant's sales team has been "enthusiastically selling deposits" with success, generating floor plan lending referrals from their dealer relationships. Management sees potential for cross-selling floor plan financing to dealers who buy equipment financed through Verdant.
On the Qualia Partnership: Axos announced a strategic partnership with Qualia, a leading escrow technology platform. CEO Garrabrants called them "a very innovative financial technology company" and noted they have exclusive territories for deposit gathering—an "interesting specialty deposit vertical."
On FDIC Portfolio: The remaining FDIC-purchased Signature loans have approximately 3-4 years of remaining life, with expected accretion of ~$6.5 million per quarter going forward. All loans in the portfolio remain current with no losses to date.
On Team Liftouts: Management indicated they've completed significant team liftouts over the past year (floor plan, technology, geographic teams) and are now focused on developing those teams rather than adding new ones in the near term.
How Did the Stock React?
Axos shares rose approximately 3% to $94.64 following the earnings release, pushing the stock within striking distance of its 52-week high of $99.82.
Valuation Snapshot:
Book value per share increased to $51.70, up 17% year-over-year from $44.17. Tangible book value per share reached $47.79, up 15.8% YoY.
The stock has outperformed regional bank peers significantly over the past year, driven by consistent earnings beats and superior profitability metrics.
What Changed From Last Quarter?
Several notable shifts from Q1 FY26:
-
NII Acceleration: Net interest income jumped 14% sequentially (vs. +4% in Q1 FY26), driven by loan growth acceleration and NIM expansion.
-
Verdant Fully Online: The acquisition is now contributing meaningfully—$3.1M pre-tax income this quarter, up from its first partial quarter in Q1.
-
Loan Growth Inflection: Quarterly loan growth of $1.64B was the highest in company history, up from $1.59B in Q1 FY26 and well above the $0.2B-$0.9B range seen in FY25.
-
Credit Quality Peak: Non-performing assets declined for the fourth consecutive quarter, now at just 0.56% of assets vs. 1.06% a year ago.
-
Efficiency Improvement: Banking segment efficiency ratio improved to 41.39% from 42.89% in Q1, despite integrating Verdant.
-
Securities Segment Gains: Axos Securities (clearing and RIA custody) improved operating income to $9.7M from $7.8M YoY. Total assets under custody increased to $44.4B, with net new assets of ~$1B in Q2 and $2B YTD.
-
Deposit Mix Strength: Average non-interest-bearing deposits grew to $3.5B from $3.0B linked quarter. The deposit base remains highly diversified: 52% consumer/small business, 22% commercial treasury management, 15% commercial specialty, 5% fiduciary services, and 5% securities custody.
Key Takeaways
The Bull Case Strengthened:
- Consistent double-digit EPS growth with 23% YoY expansion
- Best-in-class NIM of 4.94% in a challenging rate environment
- Diversified loan growth across multiple verticals
- Excellent credit quality—0.04% net charge-offs
- Verdant integration proceeding smoothly with immediate accretion
- Book value compounding at 17%+ annually
Risks to Monitor:
- CRE concentration increasing—now 34% of loan book
- Capital ratios declining slightly (CET1 at 11.65% vs 12.52% in Jun '25) due to rapid growth
- Tax rate benefit now fully embedded in estimates
- Premium valuation relative to regional bank peers
Axos continues to execute at a high level, combining digital-native efficiency with disciplined credit underwriting. The Q2 results demonstrate the bank's ability to grow earnings at a 20%+ pace while maintaining strong asset quality—a rare combination in the current banking environment.
View AX company profile | Q1 2026 earnings | Q2 2026 earnings transcript